


 Compare Slovenian waters
One map, multiple views
Explore waters across Slovenia
Choose a data view and, if useful, a colour filter. The map updates without duplicating the display.
Blue: reported drinkable by the source. Amber: drinking status unknown. This is not a live water-safety confirmation. For free refilling, check access, operation, any fees and signs on site; fountains may close seasonally.
Drinking safety is unconfirmed — not for direct drinking without appropriate treatment.
Official NUV2 water-body inventory, not a record of every stream or small lake. Select a river or lake for its name and details. Treatment selection requires a water analysis and verification of the result.
Ask about water-treatment technology →Drinking safety is unconfirmed — not for direct drinking without appropriate treatment.
Official NUV2 water-body inventory, not a record of every stream or small lake. Select a river or lake for its name and details. Treatment selection requires a water analysis and verification of the result.
Ask about water-treatment technology →How is the comparison calculated?
TDS is an estimated value calculated from electrical conductivity at 20 °C using a conversion factor of 0.65 (TDS ≈ EC × 0.65).
Selected water source: Mild dishes. Character is positioned using the TDS calculation from card 6 and is not a water-quality rating.
Important: The displayed deviation means that E. coli or enterococci were detected in a specific sample at the time of sampling. This result does not necessarily mean that the deviation is still present today. When non-compliance is identified, water utilities typically take appropriate corrective measures and carry out follow-up monitoring. To assess the current situation, please refer to the latest results or official notices from the responsible water utility.
Note
Important:
How to understand the displayed results
The values shown represent the results of individual water samples at the time of sampling and are not real-time measurements.
For parameters with an established limit value, the colour scale shows the measured concentration as a percentage of the applicable EU limit value. Lower, medium and higher values within the limit represent different concentration levels and do not, by themselves, indicate that the water is non-compliant or unsafe to drink. Exceedances of the limit value are shown separately (see: Above EU limit).
Results may change over time. Water quality can be influenced by natural and weather conditions, activities in the surrounding environment, the condition of the water source, water treatment, the distribution network and other factors. Since many parameters require laboratory analysis, a complete real-time assessment of water quality is not possible.
Each result therefore represents the analysed sample at a specific time and location and does not necessarily reflect the current quality of water at the tap.
For information on current compliance, any measures in place or restrictions on water use, always refer to the latest results and official notices from the responsible water utility. In cooperation with water utilities, EWSA will continuously work to make the latest available information accessible through this platform.
How the EWSA comparison scale works
The limit values are based on applicable European requirements for drinking water quality. To make the results easier to understand and compare, EWSA has further divided the range below each limit value into informative categories. These categories are an EWSA comparison tool, not official EU classifications, and do not in themselves represent an assessment of health risk.
100% represents the applicable limit value for the individual parameter. Values below 100% show what proportion of that limit was measured in the analysed sample, while values above 100% indicate that the applicable limit value was exceeded in that sample.
Note
Important:
How to understand the displayed results
The values shown represent the results of individual water samples at the time of sampling and are not real-time measurements.
For parameters with an established limit value, the colour scale shows the measured concentration as a percentage of the applicable EU limit value. Lower, medium and higher values within the limit represent different concentration levels and do not, by themselves, indicate that the water is non-compliant or unsafe to drink. Exceedances of the limit value are shown separately (see: Above EU limit).
Results may change over time. Water quality can be influenced by natural and weather conditions, activities in the surrounding environment, the condition of the water source, water treatment, the distribution network and other factors. Since many parameters require laboratory analysis, a complete real-time assessment of water quality is not possible.
Each result therefore represents the analysed sample at a specific time and location and does not necessarily reflect the current quality of water at the tap.
For information on current compliance, any measures in place or restrictions on water use, always refer to the latest results and official notices from the responsible water utility. In cooperation with water utilities, EWSA will continuously work to make the latest available information accessible through this platform.
How the EWSA comparison scale works
The limit values are based on applicable European requirements for drinking water quality. To make the results easier to understand and compare, EWSA has further divided the range below each limit value into informative categories. These categories are an EWSA comparison tool, not official EU classifications, and do not in themselves represent an assessment of health risk.
100% represents the applicable limit value for the individual parameter. Values below 100% show what proportion of that limit was measured in the analysed sample, while values above 100% indicate that the applicable limit value was exceeded in that sample.
TDS of individual water supplies
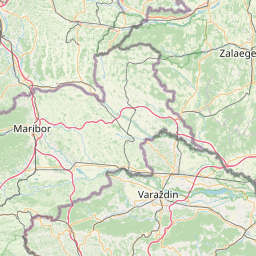
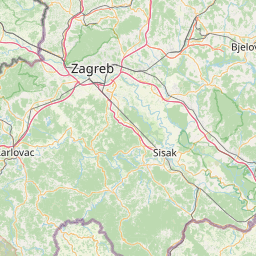
TDS categories include all water supplies with available data; the map shows those with a usable coordinate.
0 water supplies in the dataset · 0 on the map
Sorted from the lowest to the highest TDS value.
Composition and health safety
Krvavec
Komunala Kranj, d.o.o. · 2024-08-23
Tap water — Water source / Izvor
- Podzemna voda / Groundwaterizviri · vodnjaki · arteški vodonosniki / springs · wells · artesian aquifers
- Površinska voda / Surface waterreke · jezera · akumulacijska jezera in rezervoarji / rivers · lakes · reservoirs
- Padavinska voda / Rainwater
- Razsoljena morska / Desalinated seawater
- Prečiščena odpadna voda / Treated wastewater
Minerals and daily intake
TopCalcium, magnesium, sodium and other ions create the character of the water, so they are shown both as a readable profile and as laboratory values.
According to the World Health Organization (WHO), drinking water can contribute significantly to daily calcium and magnesium intake. Waters with lower mineralisation generally contribute less to daily intake of essential minerals compared with more mineral-rich waters.
The marker shows how much of each mineral is present in one litre of water and, therefore, how much you consume by drinking one litre of that water. The scale compares this amount with the approximate recommended daily intake for a healthy adult.
Monitored parameters
Safety and other chemical parameters
Water treatment: ultrafiltration, regular disinfection, disinfection with sodium hypochlorite
A missing result means we do not yet have the data. We are awaiting water utility data; this is not a measurement or confirmation of compliance.
| Parameter | Result | EU limit | Status | Sample date |
|---|---|---|---|---|
| E. coli | not found CFU/100 mL | 0 CFU/100 mL | Within limit | 2024-08-23 |
| Enterococci | not found CFU/100 mL | 0 CFU/100 mL | Within limit | 2024-08-23 |
| Ammonium (NH₄⁺) | <0.02 mg/L | 0.5 mg/L | Within limit | 2024-08-23 |
| Nitrite (NO₂⁻) | <0.01 mg/L | 0.5 mg/L | Within limit | 2024-08-23 |
| Nitrate (NO₃⁻) | 4.5 mg/L | 50 mg/L | Within limit | 2024-08-23 |
| Nitrate/50 + nitrite/3 | ≈ 0.0933 index | 1 index | Within limit | 2024-08-23 |
| Sulfate (SO₄²⁻) | 4.2 mg/L | 250 mg/L | Within limit | 2024-08-23 |
| Chloride (Cl⁻) | 6.1 mg/L | 250 mg/L | Within limit | 2024-08-23 |
| Fluoride (F⁻) | <1 mg/L | 1.5 mg/L | Within limit | 2024-08-23 |
| Sodium (Na⁺) | 2.3 mg/L | 200 mg/L | Within limit | 2024-08-23 |
| Arsenic (As) | <1 µg/L | 10 µg/L | Within limit | 2024-08-23 |
| Lead (Pb) | <1 µg/L | 10 µg/L | Within limit | 2024-08-23 |
| Pesticides (sum) | <0.05 µg/L | 0.5 µg/L | Within limit | 2024-08-23 |
No matching parameter.
Choose a chemical parameter in the table to show it on the map. Results may refer to different sampling dates.
Note
Results marked with '<' mean the concentration was below the determination limit of the laboratory method used.
Important:
How to understand the displayed results
The values shown represent the results of individual water samples at the time of sampling and are not real-time measurements.
For parameters with an established limit value, the colour scale shows the measured concentration as a percentage of the applicable EU limit value. Lower, medium and higher values within the limit represent different concentration levels and do not, by themselves, indicate that the water is non-compliant or unsafe to drink. Exceedances of the limit value are shown separately (see: Above EU limit).
Results may change over time. Water quality can be influenced by natural and weather conditions, activities in the surrounding environment, the condition of the water source, water treatment, the distribution network and other factors. Since many parameters require laboratory analysis, a complete real-time assessment of water quality is not possible.
Each result therefore represents the analysed sample at a specific time and location and does not necessarily reflect the current quality of water at the tap.
For information on current compliance, any measures in place or restrictions on water use, always refer to the latest results and official notices from the responsible water utility. In cooperation with water utilities, EWSA will continuously work to make the latest available information accessible through this platform.
How the EWSA comparison scale works
The limit values are based on applicable European requirements for drinking water quality. To make the results easier to understand and compare, EWSA has further divided the range below each limit value into informative categories. These categories are an EWSA comparison tool, not official EU classifications, and do not in themselves represent an assessment of health risk.
100% represents the applicable limit value for the individual parameter. Values below 100% show what proportion of that limit was measured in the analysed sample, while values above 100% indicate that the applicable limit value was exceeded in that sample.
Your selection
Compare up to four waters
Choose a supply in the search or map, then click “Add this water to comparison” in its profile. The selection is saved only in this browser, without registration; it does not sync across devices.
Composition differences are not a quality ranking or confirmation of drinking safety. Results may come from different sample dates; missing data is not replaced with zero.